TL;DR
Imagine securing your family's future with life insurance, safeguarding against critical illness, or protecting your income should you be unable to work. You diligently complete the application, disclose your medical history, and detail your lifestyle. But did you know that something as seemingly innocuous as your postcode could significantly influence the premium you pay, or even the terms offered?
Key takeaways
- Age: Generally, the younger you are, the lower your premium, as the risk of illness or death increases with age.
- Medical History: Past and present health conditions are thoroughly reviewed. This includes chronic diseases, previous surgeries, and family medical history.
- Lifestyle: Smoking status, alcohol consumption, drug use, diet, and exercise habits all play a significant role. Smokers, for instance, typically pay substantially higher premiums.
- Occupation: Certain professions are deemed riskier due to the nature of the work (e.g., working at heights, heavy machinery operation), which can impact income protection more directly.
- Hobbies/Pastimes: High-risk hobbies like skydiving, mountaineering, or motorsport can also lead to higher premiums or exclusions.
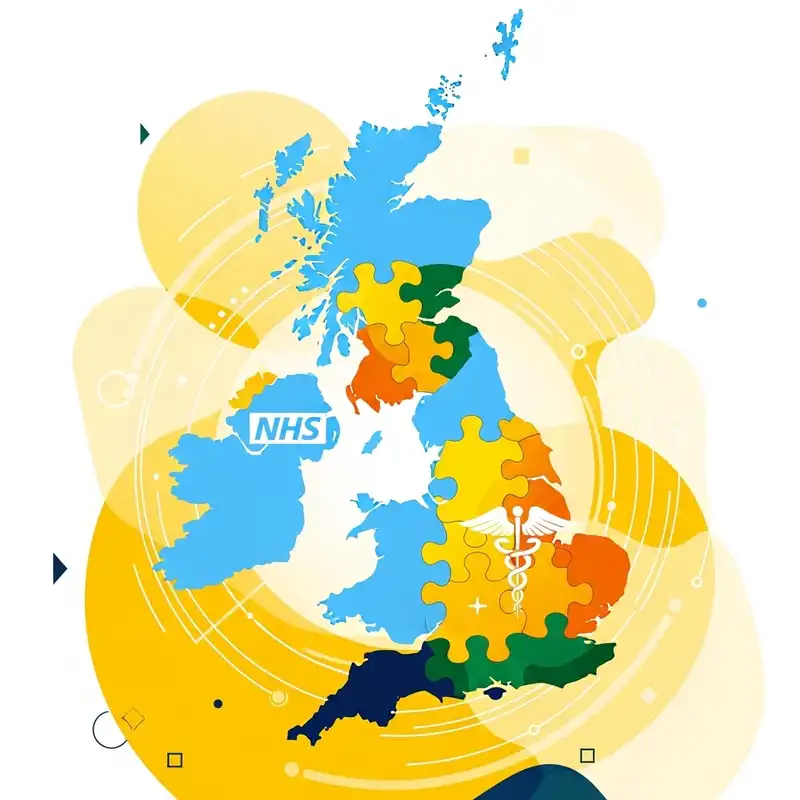
UK Health Insurance Postcode Risk
UK LCIIP Regional Health Data & Underwriting – Which Insurers Best Map Risk for Your Postcode
Introduction: The Hidden Geography of Your Insurance Premium
Imagine securing your family's future with life insurance, safeguarding against critical illness, or protecting your income should you be unable to work. You diligently complete the application, disclose your medical history, and detail your lifestyle. But did you know that something as seemingly innocuous as your postcode could significantly influence the premium you pay, or even the terms offered?
In the intricate world of UK Life, Critical Illness, and Income Protection (LCIIP) insurance, your geographical location is far more than just an address. It's a data point, one piece of a vast, complex puzzle insurers use to assess risk. The disparities in health outcomes across the UK are well-documented, creating a fascinating, albeit sometimes frustrating, landscape for both individuals and the insurance industry. From life expectancy variances to regional prevalence of chronic diseases, the UK's health map is as diverse as its landscape.
This comprehensive guide delves deep into how regional health data shapes LCIIP underwriting in the UK. We'll explore the 'postcode lottery' of health, the sophisticated methods insurers employ to analyse this data, and crucially, identify which providers are most adept at accurately mapping risk to your specific location. Our aim is to demystify this often-opaque aspect of insurance, empowering you with the knowledge to make informed decisions and secure the most suitable and cost-effective cover.
The Foundation: Understanding LCIIP Insurance
Before we dissect the impact of geography, let's briefly define the pillars of personal protection insurance in the UK:
- Life Insurance (LI): Provides a lump sum payment to your beneficiaries upon your death within the policy term. Its primary purpose is to provide financial security for your loved ones, covering mortgages, debts, or daily living expenses.
- Critical Illness Cover (CIC): Pays out a tax-free lump sum if you are diagnosed with a specified serious illness (e.g., certain cancers, heart attack, stroke) during the policy term. This sum can help cover medical costs, adapt your home, replace lost income, or simply provide peace of mind during recovery.
- Income Protection (IP): Replaces a percentage of your income (typically 50-70%) if you're unable to work due to illness or injury. Unlike critical illness cover, it doesn't require a specific diagnosis, making it a broader safety net. Payments continue until you return to work, the policy ends, or you retire.
These three forms of protection are fundamental to a robust financial plan, shielding you and your family from life's unexpected challenges. Their effectiveness, however, hinges on how accurately your individual risk is assessed, and that's where underwriting comes in.
The Underwriting Jigsaw: How Insurers Assess Risk
Underwriting is the process by which an insurer evaluates the risk associated with insuring a particular individual or asset. For LCIIP products, this involves a meticulous assessment of various factors to determine eligibility, policy terms, and the premium payable. The goal is fair pricing – ensuring that those with higher risks contribute appropriately to the shared risk pool, while those with lower risks aren't overcharged.
Key factors traditionally considered by LCIIP underwriters include:
- Age: Generally, the younger you are, the lower your premium, as the risk of illness or death increases with age.
- Medical History: Past and present health conditions are thoroughly reviewed. This includes chronic diseases, previous surgeries, and family medical history.
- Lifestyle: Smoking status, alcohol consumption, drug use, diet, and exercise habits all play a significant role. Smokers, for instance, typically pay substantially higher premiums.
- Occupation: Certain professions are deemed riskier due to the nature of the work (e.g., working at heights, heavy machinery operation), which can impact income protection more directly.
- Hobbies/Pastimes: High-risk hobbies like skydiving, mountaineering, or motorsport can also lead to higher premiums or exclusions.
However, a crucial, yet often overlooked, piece of this jigsaw is regional health data. Insurers don't just look at your health; they also consider the aggregated health profile of the area you live in. This is because health outcomes are demonstrably linked to geographical location due to a myriad of socio-economic, environmental, and healthcare access factors.
The UK's Health Landscape: A Postcode Lottery?
The concept of a 'postcode lottery' for health in the UK is not a new one. Decades of research, predominantly from organisations like the Office for National Statistics (ONS) and Public Health England (now the UK Health Security Agency - UKHSA), highlight persistent and often widening health inequalities across the nation.
Health Inequalities in the UK: Stark Realities
Life expectancy, a fundamental indicator of population health, varies significantly across the UK. For example, a baby boy born in Kensington and Chelsea can expect to live nearly 10 years longer than one born in Glasgow City. Similarly, for women, the gap can be over 7 years between the healthiest and least healthy areas.
These disparities extend beyond longevity to the prevalence of chronic diseases:
- Cardiovascular Disease (CVD): Areas with higher levels of deprivation often exhibit higher rates of heart disease and stroke. The North East of England, for instance, typically has higher rates of premature death from CVD compared to the South East.
- Cancer: While cancer is complex, regional differences in lifestyle factors (smoking rates, obesity) and access to early diagnosis and treatment can influence incidence and survival rates.
- Diabetes: The prevalence of Type 2 diabetes is often correlated with deprivation, diet, and physical inactivity, leading to higher rates in some urban and industrialised areas.
- Respiratory Diseases: Areas with historical industrial activity or poor air quality (e.g., some parts of London and other major cities) may see higher rates of conditions like asthma and chronic obstructive pulmonary disease (COPD).
- Mental Health: While geographically widespread, the intensity and access to support for mental health issues can vary significantly, often correlating with socio-economic status and urbanisation.
Table 1: UK Health Inequalities - Regional Snapshot (Illustrative Data)
| Indicator | Area of High Performance (Example) | Area of Lower Performance (Example) | Difference/Trend | Data Source/Year (Illustrative) |
|---|---|---|---|---|
| Male Life Expectancy at Birth | Kensington & Chelsea (84.4 years) | Glasgow City (74.7 years) | ~9.7 years difference. Strong correlation with deprivation. | ONS, 2017-19 |
| Female Life Expectancy at Birth | East Dorset (87.2 years) | West Dunbartonshire (79.0 years) | ~8.2 years difference. Similar deprivation correlation. | ONS, 2017-19 |
| Mortality from CVD (under 75s) | South West (lowest rates) | North East (highest rates) | Significant regional variation, often double in some areas compared to others. | NHS/PHE, Latest Annual Data |
| Obesity Prevalence (Adults) | South East (lower rates) | North East / West Midlands (higher rates) | Up to 10 percentage point difference between regions, with socio-economic links. | NHS Digital, Annual |
| Smoking Prevalence (Adults) | South West (lowest rates) | North East (highest rates) | Clear geographical clusters for smoking habits, impacting respiratory and cancer risks. | ONS, Annual |
| Air Pollution (PM2.5) | Rural areas (lower) | Major cities (higher) | Urban centres often exceed WHO guidelines, increasing risk of respiratory and cardiovascular issues. | UKHSA/DEFRA, Annual |
Note: Specific figures are illustrative and based on general trends and reported data at the time of writing. For the most up-to-date statistics, always refer to the latest ONS, NHS, and UKHSA reports.
Data Sources for Regional Health: Insurers' Toolkit
To understand these disparities, insurers leverage a wealth of publicly available and proprietary data:
- Office for National Statistics (ONS): A cornerstone for demographic and health data. This includes life expectancy tables, mortality rates by cause and geography, population census data, and national health surveys.
- NHS Data (NHS Digital, NHS England, Public Health Scotland, etc.): Aggregated hospital admission data, GP patient surveys, disease prevalence registries (e.g., cancer registries), and prescribing data provide insights into regional health burdens and healthcare utilisation.
- UK Health Security Agency (UKHSA) / Public Health England (PHE) Legacy Data: Local health profiles, environmental health data (e.g., air quality monitoring), and reports on health behaviours offer granular insights into specific local authority areas.
- Environmental Data: Information on pollution levels (air, water, noise), access to green spaces, and urbanisation levels, which are increasingly recognised for their impact on physical and mental health.
- Socio-economic Data: Measures of deprivation (Index of Multiple Deprivation - IMD), employment rates, income levels, and educational attainment, all of which correlate strongly with health outcomes.
- Academic Research: Peer-reviewed studies on health determinants and outcomes by geography.
By combining these diverse datasets, insurers build sophisticated models that map specific health risks to postcodes or groups of postcodes.
Impact on LCIIP Underwriting: From Data to Decision
The impact of this regional data on LCIIP underwriting is multifaceted:
- Risk Stratification: Insurers use regional data to create a 'baseline' risk profile for a given area. If you live in an area with statistically higher rates of certain critical illnesses or lower life expectancy, your initial risk profile might be adjusted upwards before individual factors are considered.
- Premium Adjustment: For LCIIP products, this can translate into slightly higher premiums for individuals residing in 'higher risk' postcodes, even if their personal health is excellent. Conversely, living in a 'lower risk' postcode might contribute to a more favourable premium.
- Targeted Questioning: In some cases, insurers might ask more detailed questions about lifestyle or family history if you reside in an area known for specific health challenges.
- Underwriting Flexibility: While the data provides a general picture, sophisticated insurers understand that it's a statistical probability, not a certainty for an individual. They aim to balance population-level trends with individual medical information.
It's crucial to understand that regional data rarely leads to outright refusal of cover. Instead, it refines the risk assessment, ensuring the premium charged reflects the overall risk profile more accurately.
The Actuarial Science: Translating Data into Premiums
At the heart of insurance is actuarial science – the discipline that applies mathematical and statistical methods to assess risk in insurance, finance, and other industries. Actuaries are the engineers of insurance products, designing them to be both financially viable for the insurer and fair to the policyholder.
For LCIIP, regional health data feeds directly into these actuarial models. Here's a simplified view of how it works:
- Population Segmentation: Insurers segment the UK population not just by age and gender, but increasingly by geographic location. This creates smaller, more homogenous 'risk pools'.
- Mortality and Morbidity Tables: Actuaries develop or adapt mortality (death) and morbidity (illness) tables. These tables predict the likelihood of a person dying or developing a critical illness within a given period, segmented by various factors. Regional health data refines these tables, showing, for example, that the likelihood of a heart attack in one postcode district might be 1.5 times higher than in another.
- Risk Weighting: Each data point (age, medical history, lifestyle, and postcode) is assigned a risk weighting. The combination of these weightings determines an individual's overall risk score.
- Premium Calculation: The risk score, combined with the desired benefit amount and policy term, is fed into algorithms to calculate the final premium. A higher risk score generally leads to a higher premium.
- Re-evaluation: Actuarial models are not static. They are constantly updated with new data, allowing insurers to refine their understanding of risk over time. This means that an insurer's 'mapping' of postcode risk can evolve.
Challenges in Data Application:
- Granularity vs. Generalisation: Insurers constantly balance the desire for granular data (e.g., street-level data) with the need for statistically significant samples and privacy considerations. Most operate at a postcode sector (e.g., SW1A 0) or district (e.g., SW1A) level, rather than individual houses.
- Data Lag: Health data can take time to be collected, analysed, and published. Actuaries must work with the most recent reliable data, but there can be a lag between real-world changes in health outcomes and their reflection in the models.
- Avoiding Discrimination: There's a fine line between risk-based pricing and unintentional discrimination. Regulators like the Financial Conduct Authority (FCA) monitor insurers to ensure their underwriting practices are fair and transparent. Insurers must be able to justify how regional data is used and ensure it doesn't unfairly penalise individuals solely based on location without considering their personal circumstances.
Which Insurers Excel at Postcode-Specific Underwriting?
It's a common misconception that all insurers assess risk in exactly the same way. While they all use similar data points, their underwriting philosophies, actuarial models, and the sophistication of their data analytics capabilities differ significantly. This is particularly true when it comes to how they interpret and apply regional health data.
No single insurer can be definitively labelled "the best" for every individual, as the optimal choice always depends on your unique circumstances. However, we can identify characteristics of insurers who tend to be more nuanced and effective in mapping risk, including that associated with your postcode:
Characteristics of Insurers Excelling in Regional Risk Mapping:
- Advanced Data Analytics & AI Investment: Insurers who invest heavily in modern data science tools and artificial intelligence can process larger, more complex datasets. This allows for more granular analysis of regional health trends and a more dynamic approach to risk assessment. They can identify emerging health patterns more quickly.
- Granularity of Analysis: Some insurers operate with a finer geographic resolution. Instead of just looking at county-level or broad postcode district data, they might delve into postcode sectors or even use proprietary mapping tools that factor in hyper-local environmental and socio-economic data.
- Flexible Underwriting Guidelines: While data-driven, the best insurers combine algorithmic assessment with human expertise. They have underwriters who can review individual cases, even if the postcode flags a higher risk, to understand specific mitigating factors. This means they are less likely to apply a blanket loading solely based on location if your personal health profile is excellent.
- Regular Data Updates & Model Refinement: The health landscape evolves. Insurers who frequently update their regional health models with the latest ONS, NHS, and UKHSA data are better positioned to reflect current realities rather than relying on outdated statistics.
- Holistic Risk Assessment: Rather than over-indexing on one factor (like postcode), these insurers integrate regional data seamlessly into a holistic view of the applicant. Your personal medical history, lifestyle, and positive health choices can often offset any statistical disadvantage posed by your address.
Leading Insurers (General Approaches, not specific endorsements):
- Established Market Leaders (e.g., Legal & General, Aviva, Royal London, Scottish Widows): These providers benefit from vast historical datasets spanning decades. Their actuarial teams are typically large and experienced, allowing for sophisticated model building and refinement. They often have the resources to invest in advanced analytics.
- Insurers with a Focus on Individualised Pricing (e.g., Vitality, although their primary driver is lifestyle engagement): While Vitality's model is more about encouraging healthy behaviours through rewards, their underlying philosophy is highly individualised risk assessment. This demonstrates an ability to move beyond broad generalisations, which can sometimes translate to a more nuanced view of geographic risk too.
- Specialist or Niche Providers: Some smaller or more specialist insurers may have underwriting teams that are more willing to consider complex cases and delve deeper into individual circumstances, potentially mitigating the impact of a 'higher risk' postcode if the personal health details are strong.
Important Caveat: It's practically impossible to definitively name "the best" insurer for postcode-specific underwriting without having access to their proprietary algorithms and real-time quoting engines. Their competitive advantages shift, and what works best for one person's postcode might not for another.
Table 2: Key Underwriting Factors & Regional Data's Influence
| Underwriting Factor | How it's Assessed | Role of Regional Health Data |
|---|---|---|
| Age | Direct input, age at application. | General life expectancy data by region can subtly influence age-based mortality tables, though individual age is primary. |
| Medical History | GP reports, medical exams, personal declarations. | Regional prevalence of certain conditions (e.g., heart disease, diabetes) might lead to more scrutiny or specific questions if you live in a high-incidence area, even if you are currently healthy. |
| Lifestyle | Smoking status, alcohol intake, diet, exercise. | Regional statistics on smoking rates, obesity levels, and physical activity can inform baseline assumptions about lifestyle risk, even if you personally defy the regional average. |
| Occupation | Job title, duties, industry. | Less direct. However, regional economic data can correlate with certain high-risk industries clustered in specific areas. |
| Postcode/Location | Direct input, your residential address. | Primary impact. Directly linked to aggregated regional health statistics (life expectancy, disease prevalence, environmental factors). Can lead to direct premium loadings or discounts. |
| Family History | Declared history of critical illness/death in close relatives. | Less direct. However, if family history combines with a region known for high incidence of that specific condition, it might reinforce the overall risk assessment. |
| Benefit Amount | Your requested sum assured for LI/CIC, or income for IP. | No direct link to regional health, but the financial scale of the risk being covered. |
| Policy Term | How long you want cover (e.g., 20 years, whole of life). | Longer terms inherently carry more risk. Regional health data helps project mortality/morbidity over extended periods for specific geographies. |
Real-World Impact: Case Studies and Examples
To illustrate the tangible effect of regional health data, let's consider a few hypothetical scenarios:
Scenario 1: The 'Healthy' Applicant in a High-Risk Postcode
- Applicant: Sarah, 35, non-smoker, healthy BMI, exercises regularly, no significant medical history.
- Location: Lives in a postcode in a major industrial city with historically higher rates of respiratory diseases and lower life expectancy due to deprivation and past environmental factors.
- Outcome: When Sarah applies for Critical Illness Cover, Insurer A, using broad regional data, applies a small loading to her premium based on her postcode, despite her excellent personal health. Insurer B, with more nuanced underwriting, looks beyond the postcode to Sarah's individual GP records, which confirm her robust health, and offers a standard premium, potentially saving her money over the policy term.
Scenario 2: The 'Average' Applicant in a Low-Risk Postcode
- Applicant: David, 45, light drinker, slightly overweight, but no current health issues.
- Location: Lives in an affluent rural village with excellent air quality, high life expectancy, and low rates of chronic illness.
- Outcome: David's application for Income Protection benefits from his postcode. Even with a slightly less-than-perfect lifestyle, the favourable health statistics of his area contribute to a more competitive premium offer from most insurers, reflecting the lower overall population risk in his vicinity.
Scenario 3: Pre-existing Condition and Regional Specialism
- Applicant: Maria, 50, diagnosed with an early-stage, well-managed, non-aggressive form of cancer five years ago. She has been in remission.
- Location: Lives close to a world-renowned specialist cancer treatment centre.
- Outcome: While Maria's pre-existing condition is the primary factor, an insurer with sophisticated regional analysis might consider the proximity to excellent specialist care as a mitigating factor. If the region also has superior post-treatment follow-up data, it could subtly influence the terms, leading to a more favourable offer than if she lived in an area with less accessible or less specialised care.
These examples highlight that while your postcode is a factor, it's rarely the only factor. The interaction between your personal health profile and the aggregated regional data is key, and different insurers weigh these interactions differently.
Navigating the LCIIP Market: Your Role and Our Help
Understanding that regional health data influences your LCIIP premiums is the first step. The next is to leverage this knowledge to secure the best possible cover.
What You Can Do:
- Be Honest and Detailed: Always provide complete and accurate information on your application. Non-disclosure can invalidate your policy. The more detail you provide about your personal health and lifestyle, the more accurately an insurer can assess your individual risk, potentially overriding broad regional assumptions.
- Understand Your Own Health Profile: Be aware of your medical history, family history, and lifestyle habits. This helps you anticipate potential underwriting questions and ensures you're prepared.
- Don't Assume Your Postcode is a Barrier: Living in an area flagged as 'higher risk' statistically does not mean you will always pay more or be declined. Your personal health profile remains paramount. Many individuals in such areas secure excellent terms.
- Embrace Comparison: Do not accept the first quote you receive. Different insurers will have different underwriting appetites and regional risk mapping.
The Value of an Independent Broker: This is Where WeCovr Comes In
Navigating the complex world of LCIIP insurance, especially when regional data is a factor, can be daunting. This is where an expert independent broker like WeCovr becomes invaluable. We work with all major UK insurers, understanding their unique underwriting philosophies, including how they factor in regional health data.
- Access to Multiple Insurers: We don't just offer one option. We can compare plans from all major UK insurers, giving you a comprehensive view of the market.
- Underwriting Insights: We have in-depth knowledge of each insurer's underwriting guidelines, helping us anticipate how your specific health profile and postcode might be viewed by different providers. We can often pre-assess your situation with underwriters, giving you a clearer picture before a formal application.
- Tailored Recommendations: Based on your personal health, lifestyle, financial needs, and yes, your postcode, WeCovr can recommend the insurers most likely to offer you the most competitive terms. We can help you navigate the complexities, ensuring you receive quotes that accurately reflect your individual risk, not just a broad postcode generalisation.
- Saving Time and Effort: Instead of you spending hours researching and filling out multiple applications, we streamline the process, saving you time and effort.
- Advocacy: If a challenge arises during underwriting, WeCovr acts as your advocate, liaising with the insurer on your behalf to present your case in the most favourable light.
Future Trends: What's Next for Regional Underwriting?
The intersection of health, data, and insurance is constantly evolving. Here are some trends shaping the future of regional underwriting in the UK:
- Hyper-Local Data Analytics: As data collection and processing capabilities advance, insurers may move beyond broad postcode data to even more granular insights, potentially utilising geo-spatial analysis down to street or even building level, factoring in hyper-local environmental factors and community health initiatives.
- Predictive Analytics and AI: The use of artificial intelligence and machine learning will become even more sophisticated, enabling insurers to identify subtle patterns in health data that human analysis might miss, leading to more precise risk predictions. This, combined with regional data, could create an incredibly dynamic and personalised risk assessment, though privacy concerns remain paramount.
- Ethical Considerations and Regulation: As data becomes more granular, the debate around the 'postcode lottery' and potential for unfair discrimination will intensify. Regulators will likely play an increasing role in ensuring transparency, fairness, and responsible use of personal and regional health data.
- Environmental Factors Growing in Prominence: The impact of climate change and local environmental degradation (e.g., air pollution, flood risk) on health is gaining recognition. Insurers may increasingly factor these specific environmental risks, unique to certain regions, into their underwriting models for LCIIP products.
- Focus on Prevention and Wellness: Some insurers are already shifting towards models that encourage wellness and prevention. Regional data can help identify areas where targeted health interventions might be beneficial, potentially leading to lower overall risk and premiums for those communities in the long run.
Table 3: Sources of Regional Health Data for Insurers
| Data Source Category | Specific Examples / Types of Data | How Insurers Utilise It |
|---|---|---|
| Demographic & Mortality Data | ONS data (Life expectancy by MSOA/LSOA, mortality rates by cause, population density, age structure). | Establishes baseline mortality/morbidity probabilities for specific geographic areas. Identifies areas with lower/higher life expectancies. |
| Health & Disease Prevalence | NHS Digital (Hospital Episode Statistics - HES), GP patient data (anonymised), Cancer Registries, Diabetes Registries, Public Health reports. | Quantifies prevalence of critical illnesses (e.g., heart disease, cancer, stroke, diabetes) and chronic conditions (e.g., COPD, mental health issues) at regional/local levels. Informs risk for CIC and IP. |
| Environmental Data | DEFRA (Air quality monitoring, pollution levels), Environment Agency (Flood risk, contaminated land), Greenspace information. | Assesses environmental health hazards (e.g., high air pollution linked to respiratory/cardiovascular disease, noise pollution linked to stress) specific to certain postcodes. |
| Socio-Economic Data | Index of Multiple Deprivation (IMD), ONS Census data (Income, education, employment rates, access to services). | Recognises the strong correlation between deprivation and poorer health outcomes. Areas with higher deprivation may have higher statistical health risks. |
| Healthcare Access & Utilisation | NHS data on access to GP services, hospital waiting times, specialist care facilities, health inequalities reports. | Indirectly influences risk by indicating access to timely diagnosis and treatment, which can affect prognosis and long-term health outcomes. |
| Lifestyle & Behavioural Data | ONS surveys (Smoking rates, obesity rates, physical activity levels by region), Public Health campaigns and data. | Provides aggregated insights into prevalent lifestyle risks (e.g., high smoking rates in certain communities) which can increase overall health risk for a given area. |
| Proprietary Data & Models | Insurers' own historical claims data, actuarial models, big data analytics, AI algorithms. | Refines public data into specific risk weightings and pricing models. Continuously learns from claims experience to improve accuracy of postcode-specific risk assessment. |
Conclusion: Empowering Your LCIIP Decisions
The world of UK LCIIP underwriting is complex, and your postcode is undeniably a factor that influences the assessment of your risk. The UK's diverse health landscape, marked by significant regional inequalities, necessitates that insurers leverage sophisticated data to price their products fairly. While it might seem like a 'postcode lottery', it's primarily an actuarial science aimed at segmenting risk more accurately.
However, it's crucial to remember that regional data is just one piece of your personal puzzle. Your individual health, lifestyle, and medical history remain paramount. The key to securing the most suitable and cost-effective cover lies in understanding how these factors interact and, most importantly, knowing which insurers are best equipped to interpret your unique circumstances.
Don't let assumptions about your postcode dictate your protection choices. By seeking expert guidance and comparing options across the market, you can ensure you secure the robust financial safety net your family deserves, tailored precisely to your needs, regardless of where you call home.
Sources
- Office for National Statistics (ONS): Mortality and population data.
- Association of British Insurers (ABI): Life and protection market publications.
- MoneyHelper (MaPS): Consumer guidance on life insurance.
- NHS: Health information and screening guidance.
Disclaimer: This is general guidance only and does not constitute formal tax or financial advice. Tax treatment depends on individual circumstances, policy terms, and HMRC interpretation, which cannot be guaranteed in advance. Whenever applicable, businesses and individuals should always consult a qualified accountant or tax adviser before arranging such policies.