TL;DR
Before we explore the intricacies of postcode influence, let's briefly recap what LCIIP stands for and the crucial role each component plays in securing your financial future.
Key takeaways
- Data Ingestion: Insurers continuously feed their systems with updated data from sources like the ONS, NHS Digital, Police.uk, and private data providers.
- Segmentation: Using algorithms, they segment the UK's millions of postcodes into thousands of unique geodemographic clusters.
- Risk Assignment: Each cluster is assigned a risk score based on its aggregated health, mortality, and morbidity statistics. A postcode cluster with, for example, a lower average life expectancy and higher incidence of chronic diseases will be assigned a higher risk score.
- Pricing Models: This risk score then directly feeds into the pricing models. The base premium for someone in a "higher risk" postcode segment will be higher than for someone in a "lower risk" segment, even before individual factors are considered.
- Individual Underwriting: Once the postcode's baseline risk is established, the underwriter then evaluates your individual health questionnaire, medical history (via GP reports if necessary), occupation, hobbies, and smoking status to refine the premium. This is why a healthy individual in a statistically higher-risk postcode might still pay less than an unhealthy individual in a statistically lower-risk postcode.
UK LCIIP and Postcode Crime Rates How Regional Safety Data Influences Your Protection
Navigating the world of life insurance, critical illness, and income protection (LCIIP) can feel complex. Most people understand that personal factors like age, health, and lifestyle choices significantly impact their premiums. However, a less discussed but equally important factor is your postcode. The very street you live on, and the broader regional safety and socio-economic data associated with it, can subtly – and sometimes not so subtly – influence how much you pay for essential financial protection.
This comprehensive guide delves deep into the often-overlooked connection between UK postcode crime rates and regional safety data, and their surprising influence on your LCIIP premiums and insurer choices. We'll demystify how insurers assess risk, explore the underlying statistical correlations, and equip you with the knowledge to make informed decisions about your financial future.
Beyond the Obvious: Unpacking the Nuances of Protection Insurance
When you apply for life, critical illness, or income protection insurance, you're essentially asking an insurer to take on a financial risk related to your future health or mortality. Their primary goal is to assess that risk accurately. This assessment goes far beyond a simple health questionnaire or age calculation. It involves a sophisticated analysis of numerous data points, some of which might seem entirely unrelated to your personal circumstances at first glance.
While individual medical history, occupation, smoking status, and hobbies are paramount, your geographical location provides a rich tapestry of aggregated data that insurers cannot ignore. This isn't about blaming individuals for living in a particular area; it's about the actuarial science of predicting future claims based on broad statistical trends. Areas with higher aggregated risk, whether due to health disparities, environmental factors, or even socio-economic indicators indirectly linked to safety and wellbeing, will naturally be reflected in pricing.
The objective of this article is to shed light on these intricate connections, offering transparency into the underwriting process and empowering you to understand why your postcode is more than just an address to an insurer.
Understanding LCIIP: A Quick Refresher
Before we explore the intricacies of postcode influence, let's briefly recap what LCIIP stands for and the crucial role each component plays in securing your financial future.
Life Insurance
Life insurance provides a lump sum payment to your beneficiaries if you pass away during the policy term (Term Life Insurance) or at any point during your life (Whole Life Insurance). Its primary purpose is to provide financial security for your loved ones, covering debts, living expenses, or future costs like education for children.
- Purpose: To protect your dependants financially upon your death.
- Types: Term (fixed period) and Whole (lifetime cover).
- Payout: Tax-free lump sum (in most cases) to nominated beneficiaries.
Critical Illness Insurance
Critical illness insurance pays out a tax-free lump sum if you are diagnosed with one of the specific serious illnesses listed in your policy, such as certain cancers, heart attacks, or strokes. This payout can be used to cover medical costs, adapt your home, replace lost income, or simply provide financial breathing room during a challenging time.
- Purpose: To provide financial support if you are diagnosed with a severe illness.
- Common Conditions: Heart attack, stroke, certain cancers, multiple sclerosis, kidney failure, major organ transplant. (Note: Specific conditions vary by insurer and policy).
- Payout: Tax-free lump sum upon diagnosis and survival for a specified period (e.g., 14 or 28 days).
Income Protection Insurance
Income protection insurance, sometimes called Permanent Health Insurance, provides a regular tax-free income if you're unable to work due to illness or injury. It replaces a percentage of your lost earnings (typically 50-70%) until you recover, retire, or the policy term ends. This is crucial for maintaining your lifestyle and meeting financial commitments when your income stops.
- Purpose: To replace a portion of your income if you can't work due to illness or injury.
- How it Works: Monthly payments after an agreed "waiting period" (e.g., 4, 8, 13, 26, or 52 weeks).
- Benefit: Continues until you return to work, the policy ends, or you retire.
These three forms of protection, though distinct, share a common thread: they are designed to mitigate financial hardship arising from unforeseen life events. And, as we will explore, the perceived risk of these events happening can be subtly influenced by where you live.
Table 1: LCIIP at a Glance
| Insurance Type | Primary Purpose | Key Feature | Payout Type |
|---|---|---|---|
| Life Insurance | Financial security for dependants upon death | Lump sum upon death | One-off lump sum |
| Critical Illness | Financial support for serious illness diagnosis | Lump sum for specified critical conditions | One-off lump sum |
| Income Protection | Replaces lost income due to illness or injury | Regular monthly income if unable to work | Regular monthly income |
The Unseen Factor: How Crime Rates and Regional Data Intersect with Insurance Risk
It might seem counter-intuitive that local crime rates could affect your life insurance premium. After all, unless you're involved in criminal activity, how does someone else's crime impact your longevity or health? The connection is rarely direct but instead forms part of a complex web of correlations that insurers use to assess aggregated risk.
The Insurer's Perspective on Risk
Insurers are risk management companies. They thrive on predicting the likelihood of future events (like death, critical illness, or incapacitation) within a given population segment. To do this, they pool vast amounts of data, not just about individuals but also about broader demographic and geographic trends.
- Mortality/Morbidity Risk Variations: It's a statistical fact that mortality and morbidity rates (the incidence of disease) vary significantly across different regions of the UK. Factors like average life expectancy, prevalence of certain illnesses, and rates of accidents are not uniform.
- Lifestyle Factors Linked to Postcode: While an individual's lifestyle is assessed, aggregated data for a postcode can indicate propensity towards certain lifestyle factors (e.g., smoking rates, obesity levels, access to healthy food, engagement in physical activity). These are strong predictors of future health.
- Indirect Correlation with Crime Rates: Higher crime rates, particularly violent crime, are often proxy indicators for other socio-economic factors that do directly influence health and mortality. These can include:
- Deprivation: Areas with higher crime often correlate with higher levels of socio-economic deprivation. Deprivation is strongly linked to poorer health outcomes.
- Stress Levels: Living in an area perceived as less safe can lead to chronic stress, impacting mental and physical health.
- Access to Services: Deprived areas may have poorer access to healthcare facilities, green spaces, and healthy food options.
- Environmental Factors: Pollution levels can also vary by postcode and affect respiratory and cardiovascular health.
Data Sources Insurers Utilise
Insurers don't simply guess. They employ sophisticated actuarial models and draw upon a wealth of public and proprietary data sources to build a comprehensive picture of risk associated with different postcodes.
- Office for National Statistics (ONS) Data: This is a goldmine for insurers, providing crucial insights into:
- Mortality Rates: Life expectancy by region, local authority, and even smaller statistical areas.
- Health Statistics: Prevalence of long-term illnesses, obesity rates, smoking rates, mental health indicators.
- Socio-economic Data: Income levels, employment rates, education attainment, and indices of multiple deprivation.
- Police.uk Data: While not directly used for LCIIP in the same way as motor insurance, aggregated crime statistics (e.g., types of crime, prevalence) can inform the broader risk profile of an area. They feed into the overall understanding of an area's "safety" and "wellbeing."
- Local Authority Data: Information on public health initiatives, environmental quality, and demographic shifts.
- Proprietary Risk Modelling: Insurers use their own historical claims data, combined with external datasets, to develop highly granular risk models that assign a specific risk score to nearly every postcode in the UK. This goes beyond simple crime statistics to encompass a much wider range of factors.
The key takeaway is that insurers aren't penalising you directly for crime in your area. Instead, crime statistics often serve as a strong indicator, or a proxy, for a broader set of socio-economic and environmental factors that demonstrably influence health, life expectancy, and ultimately, the likelihood of a claim.
Direct and Indirect Impacts of Postcode Crime Rates on Premiums
Understanding the nuances between direct and indirect impacts is crucial to grasping how postcode data truly influences your protection premiums.
Direct Impact (Less Common but Possible)
For LCIIP policies, direct impacts of crime rates on premiums are rare, especially for standard applicants. Unlike home or motor insurance where higher crime areas directly correlate with increased theft or accident risk, your personal risk of death or critical illness isn't directly increased by your neighbour committing petty theft.
However, there can be very specific, niche circumstances where a perceived direct risk might play a role, for instance:
- High-Risk Occupations: If your job involves working in areas known for high violent crime (e.g., certain security roles, emergency services in specific districts), this might be assessed as an occupational risk rather than a postcode risk.
- Specific Policy Clauses: Some very specialised policies might have clauses related to civil unrest or specific local risks, but these are exceptions for general LCIIP.
For the vast majority of UK LCIIP applicants, the direct impact of crime rates is negligible. The influence is overwhelmingly indirect.
Indirect Impact (The Primary Mechanism)
The indirect impact is where the connection becomes significant. Crime rates, particularly those indicating wider social deprivation and instability, often correlate strongly with factors that directly influence health outcomes and life expectancy.
-
Health Outcomes: Areas with higher crime rates are frequently areas with:
- Poorer Health Infrastructure: This can include fewer NHS services, less access to GP surgeries, or longer waiting times.
- Higher Stress Levels and Mental Health Issues: Living in an environment with higher perceived threat or insecurity can lead to chronic stress, anxiety, and other mental health conditions, which have a tangible impact on physical health and longevity. Research from organisations like the Mental Health Foundation consistently links socio-economic factors to mental wellbeing disparities.
- Less Access to Healthy Lifestyle Enablers: This includes a lack of green spaces for exercise, fewer accessible sports facilities, and limited availability of affordable, fresh, healthy food options (often referred to as 'food deserts'). These factors contribute to higher rates of obesity, heart disease, and diabetes.
- Increased Risk of Accidents/Injuries: While not always directly linked to "crime," areas with poor infrastructure, less safe environments (e.g., poorly lit streets, higher traffic areas), or higher rates of substance abuse can see increased rates of accidental injury, impacting income protection claims.
- Lower Life Expectancy: This is the ultimate aggregated indicator. The ONS consistently reports significant disparities in life expectancy across different UK regions and within cities, directly correlating with levels of deprivation. For instance, the ONS reported in March 2024 that "healthy life expectancy continues to vary significantly across the country and by local authority". Generally, the most deprived areas have lower life expectancies. Given the strong correlation between deprivation and higher crime rates, this becomes a critical factor.
-
Socio-Economic Factors: Crime rates often serve as a strong proxy for:
- Income Levels and Employment Rates: Areas with higher unemployment or lower average incomes tend to exhibit higher crime rates. These economic disadvantages can lead to poorer health choices and outcomes due to financial stress and limited resources.
- Education Attainment: Lower educational attainment in an area can correlate with less health literacy and poorer long-term health behaviours.
- Deprivation and Health Inequality: The Indices of Multiple Deprivation (IMD) in the UK are powerful tools that combine various indicators (income, employment, health, education, housing, crime, environment) to rank areas by their level of deprivation. Insurers extensively use IMD data. There's a clear, well-documented link between higher deprivation and worse health outcomes, including increased mortality and morbidity. According to the King's Fund, health inequalities persist and are widening, with people in the most deprived areas dying younger and spending more of their lives in ill health.
In essence, insurers use postcode data to understand the aggregated health profile and statistical likelihood of claims for people living in similar areas. If your postcode falls into a statistical segment that, on average, exhibits lower life expectancy, higher prevalence of certain illnesses, or greater health disparities, your premiums are likely to reflect that elevated risk. Crime rates are part of the broader dataset that contributes to this overall risk assessment, not usually a standalone factor.
Table 2: Regional Factors & Potential Impact on Premiums
| Factor Category | Specific Examples (Postcode-Linked) | Potential Impact on Premiums |
|---|---|---|
| Health Outcomes | Lower average life expectancy, higher chronic disease rates | Increase |
| Socio-Economic Data | High deprivation, lower average income, high unemployment | Increase |
| Lifestyle Propensity | Higher smoking/obesity rates, lower physical activity | Increase |
| Environmental Quality | High pollution levels, poor access to green spaces | Increase |
| Access to Services | Limited access to healthcare facilities, healthy food | Increase |
| Crime Rates (Proxy) | High rates correlated with deprivation, stress, poor health | Increase (indirectly) |
Navigating the Data: What UK Statistics Reveal about Regional Disparities
The UK is a nation of significant regional disparities. These differences are not just economic; they manifest profoundly in health outcomes and, consequently, in the aggregated risk profiles insurers assess. Understanding these statistics helps contextualise why your postcode matters.
Life Expectancy & Health Inequality Hotspots
The Office for National Statistics (ONS) routinely publishes data highlighting stark differences in life expectancy across the UK. For instance, while national average life expectancy has generally improved, the gains have been uneven, and in some areas, particularly the most deprived, they have stalled or even reversed.
- North vs. South Divide: While a simplification, broad trends show lower life expectancies in many northern English regions compared to the South East. For example, in 2020-2022, male life expectancy at birth was 77.2 years in the North East, compared to 80.7 years in the South East. For females, the figures were 81.3 years in the North East and 84.4 years in the South East. These differences represent years of potential life.
- Within-City Disparities: Even within the same city, striking differences exist. For example, research has shown that in London, life expectancy can vary by over a decade between affluent and deprived boroughs, sometimes separated by just a few Tube stops.
- Leading Causes of Death: While cancer and circulatory diseases remain the leading causes of death, the prevalence of certain risk factors (smoking, obesity, unhealthy diets) and the rates of early mortality from preventable conditions show regional variations that insurers track.
These health inequalities are not random. They are deeply intertwined with socio-economic factors, access to healthcare, education, employment, and environmental conditions – all of which can vary significantly by postcode.
Crime Statistics and Their Geographic Distribution
Police.uk provides detailed crime data down to ward level. While the UK is generally a safe country, crime rates, particularly for specific types of offences, do show regional concentrations.
- Overall Crime Trends: For the year ending March 2023, the Crime Survey for England and Wales (CSEW) estimated 8.5 million incidents of crime, a 10% decrease compared with the year ending March 2020. However, police recorded crime increased by 11% compared with the year ending March 2022, indicating complexities in reporting vs. actual incidents.
- Violent Crime: While violent crime forms a smaller proportion of overall crime, it's particularly relevant to health and mortality. Certain urban areas and specific neighbourhoods within cities consistently show higher rates of violent crime incidents. Though these incidents might not directly lead to LCIIP claims, the socio-economic factors that give rise to higher violent crime often align with those that lead to poorer health outcomes.
- Correlation, Not Causation: It’s crucial to reiterate that the presence of higher crime is often a symptom of deeper socio-economic issues (like poverty, unemployment, lack of opportunity) which are the root causes of health disparities that insurers are truly concerned about. For example, areas with high levels of deprivation are statistically more likely to experience higher rates of crime, as well as higher rates of chronic illness and lower life expectancy.
The Deprivation-Health-Crime Nexus
This is arguably the most critical statistical link for insurers. The UK government's Indices of Multiple Deprivation (IMD) are a comprehensive measure of relative deprivation at the small area level (Lower Super Output Areas, LSOAs). IMD measures deprivation across seven domains: Income, Employment, Education, Health, Crime, Barriers to Housing and Services, and Living Environment.
- Strong Correlation: There is an undeniable and statistically robust correlation between areas ranking highly on the IMD (i.e., more deprived) and:
- Poorer Health Outcomes: Higher rates of long-term illness, preventable diseases, and lower life expectancies.
- Higher Crime Rates: The 'Crime' domain within IMD itself reflects this, indicating a reciprocal relationship. Areas suffering from multiple forms of deprivation often experience higher crime levels, which can further compound the challenges for residents.
- Actuarial Significance: For insurers, a postcode’s IMD ranking provides a powerful aggregated predictor of the health and mortality risk of its inhabitants. If your postcode is in the lowest quintile of deprivation (most deprived), actuarial models will reflect the statistically higher likelihood of health issues and earlier mortality compared to someone in the highest quintile.
Table 3: Illustrative UK Regional Health & Safety Data (Simplified)
| Region (Example) | Average Male Life Expectancy (2020-22) | Average Female Life Expectancy (2020-22) | IMD Health Deprivation Rank (Example) | Crime Rate (per 1000 population, illustrative) |
|---|---|---|---|---|
| North East | 77.2 years | 81.3 years | Higher | Moderate-High |
| London (Overall) | 79.5 years | 83.9 years | Mixed (Significant variation) | Moderate-High |
| South West | 79.9 years | 83.6 years | Lower | Low-Moderate |
| North West | 77.5 years | 81.9 years | Higher | Moderate-High |
| South East | 80.7 years | 84.4 years | Lower | Low |
Note: Data simplified and indicative of broad trends based on ONS and other public sources. Specific figures vary by data collection period and precise geographic boundaries.
These statistics underscore that your postcode isn't just a label; it's a proxy for a complex array of socio-economic, environmental, and health factors that collectively inform an insurer's risk assessment.
Insurer Underwriting: How Your Postcode is Processed
When you submit an application, an insurer's underwriting process kicks into gear. This isn't a human looking up your postcode on a map and making a snap judgment. It's a highly sophisticated, data-driven assessment.
Beyond Simple Postcode Checks
It’s a common misconception that if your postcode falls into a broadly "less affluent" or "higher crime" area, you'll automatically receive a higher premium. While the general principle holds true, the actual mechanism is far more nuanced. Insurers don't simply redline postcodes.
- Sophisticated Models: Underwriters use advanced statistical models and algorithms. These models do not just look at crime rates in isolation, but integrate hundreds of data points associated with a specific postcode.
- Aggregated Data, Not Individual Incidents: They are interested in aggregated data and statistical probabilities over large populations, not individual instances of crime or specific local events. Your premium isn't higher because there was a burglary on your street last week; it's higher (if it is) because the historical data for your postcode area suggests a statistically higher aggregated risk of health issues or mortality compared to other areas.
The Role of "Geodemographic Data"
Insurers rely heavily on what is known as "geodemographic data" or "geo-demographic segmentation." This involves categorising postcodes into distinct segments based on a multitude of shared characteristics. These characteristics can include:
- Demographics: Average age, household composition, marital status.
- Socio-economics: Average income, employment type, educational attainment, property values.
- Lifestyle Indicators: Propensity for certain leisure activities, health behaviours, and consumption patterns.
- Health Statistics: Aggregated data on local health conditions, life expectancy, and mortality rates (as discussed).
- Environmental Factors: Air quality, access to green spaces, traffic density.
- Crime Statistics: As a component, particularly as a proxy for social deprivation and stress levels.
By bundling postcodes into these segments, insurers can assign a risk profile to each segment. Your individual premium then starts with the baseline risk of your geodemographic segment, which is then adjusted based on your personal health, lifestyle, and other disclosures.
How Insurers Determine Risk Profiles
The process is built on actuarial science and vast datasets:
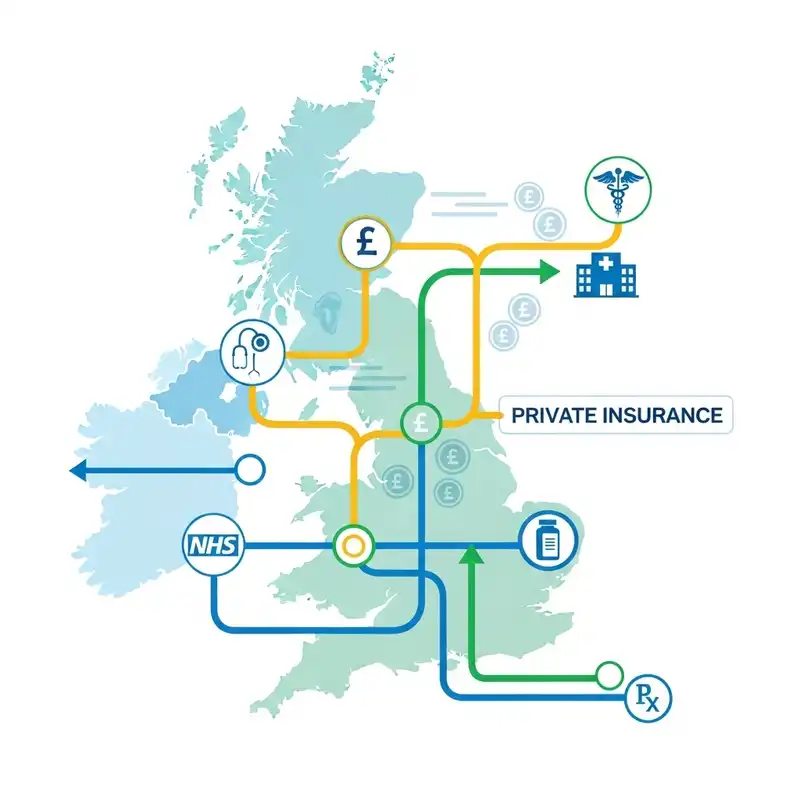
- Data Ingestion: Insurers continuously feed their systems with updated data from sources like the ONS, NHS Digital, Police.uk, and private data providers.
- Segmentation: Using algorithms, they segment the UK's millions of postcodes into thousands of unique geodemographic clusters.
- Risk Assignment: Each cluster is assigned a risk score based on its aggregated health, mortality, and morbidity statistics. A postcode cluster with, for example, a lower average life expectancy and higher incidence of chronic diseases will be assigned a higher risk score.
- Pricing Models: This risk score then directly feeds into the pricing models. The base premium for someone in a "higher risk" postcode segment will be higher than for someone in a "lower risk" segment, even before individual factors are considered.
- Individual Underwriting: Once the postcode's baseline risk is established, the underwriter then evaluates your individual health questionnaire, medical history (via GP reports if necessary), occupation, hobbies, and smoking status to refine the premium. This is why a healthy individual in a statistically higher-risk postcode might still pay less than an unhealthy individual in a statistically lower-risk postcode.
It's a dynamic process, and insurers regularly review and update their models to reflect new data and changing demographic trends. This ensures their pricing remains competitive yet profitable.
Choosing the Right Insurer: How Different Providers Approach Regional Risk
Given the complexity of underwriting, it stands to reason that not all insurers will assess regional risk in precisely the same way. This variance is crucial for consumers.
Variance in Underwriting Philosophies
While all UK insurers use data-driven underwriting, their specific algorithms, the weight they assign to various data points, and their target demographics can differ significantly.
- Risk Appetite: Some insurers might have a higher "risk appetite" for certain geographical segments or types of risk. This could be due to their own historical claims data, their market strategy, or even their re-insurance arrangements.
- Proprietary Models: Each insurer develops its own proprietary risk models. While they all use similar data inputs, the way these inputs are weighted and combined to produce a risk score can vary. This means a postcode considered "higher risk" by one insurer might be viewed as "moderate risk" by another.
- Focus Areas: Some insurers might specialise in certain markets or demographics. For example, an insurer heavily focused on younger, urban professionals might have more competitive rates for certain city postcodes compared to one primarily targeting rural, older populations.
The Importance of Shopping Around
Because of these differences in underwriting philosophies and risk models, the premium you receive for the exact same level of LCIIP cover can vary significantly from one insurer to another, even if all your personal details remain constant.
This is particularly relevant when your postcode might present a statistically higher risk. While one insurer's model might penalise your postcode more heavily, another's might assign a more favourable baseline premium, meaning their overall quote could be more competitive for you.
This is where expert brokers like WeCovr become invaluable. We work with all major UK insurers and have an in-depth understanding of their underwriting nuances. We can help you compare plans from a wide range of providers, identifying those who might be more sympathetic to your particular circumstances, including your postcode's statistical profile. Our expertise allows us to navigate the market effectively, potentially saving you a significant amount over the life of your policy.
Beyond Price: Policy Features and Customer Service
While price is undoubtedly a major factor, it shouldn't be the only one. When choosing an insurer, also consider:
- Policy Features: Do the critical illness conditions covered align with your concerns? What are the waiting periods for income protection? Are there any optional extras that add value?
- Claims Payout History: While difficult to get granular data, the overall reputation of an insurer for paying out valid claims is vital.
- Customer Service: How easy is it to deal with the insurer? Do they offer any added benefits, such as virtual GP services, mental health support, or discounts on health and fitness apps? These can add significant value and are becoming increasingly common.
A broker can guide you through these considerations, ensuring you secure not just the cheapest policy, but the right policy for your needs.
Strategies to Mitigate Higher Premiums Related to Postcode
While you can't pick up your house and move it to a statistically 'safer' or 'healthier' postcode just to save on insurance, there are proactive steps you can take to mitigate the impact of your address on your premiums.
Focus on What You Can Control
This is the most impactful strategy. Your personal health and lifestyle choices carry far more weight in underwriting than your postcode alone.
- Improve Your Health:
- Quit Smoking/Vaping: This is arguably the single biggest factor that can reduce premiums. Insurers heavily penalise smokers due to significantly increased health risks.
- Maintain a Healthy Weight: Obesity is linked to numerous health conditions. Losing weight and maintaining a healthy BMI can reduce your risk profile.
- Manage Existing Conditions: If you have pre-existing health conditions (e.g., high blood pressure, diabetes), actively managing them with medication and lifestyle changes, as advised by your GP, can demonstrate lower risk to an insurer.
- Regular Exercise and Healthy Diet: These contribute to overall wellbeing and can positively impact your risk assessment over time.
- Address Mental Health: Seeking support for mental health conditions is crucial for your overall wellbeing and can also be viewed positively if it demonstrates active management.
- Review and Reduce Risky Hobbies: If you engage in high-risk sports or activities (e.g., skydiving, mountaineering, motorsports), consider if these are truly essential or if you can mitigate the risks, as they can lead to higher premiums or exclusions.
Accurate and Honest Disclosure
Always provide full and honest information on your application. Non-disclosure, even accidental, can lead to claims being rejected, rendering your policy worthless. Insurers have access to medical information (with your consent) and will verify details. Transparency is always a strong fit for your needs.
Review Your Coverage Regularly
Life circumstances change, and so does your health. Regularly review your LCIIP policies:
- After Significant Life Events: Marriage, children, buying a new home, or changing jobs are all triggers to review your coverage.
- Health Improvements: If you've quit smoking, significantly improved your health, or managed a pre-existing condition, your risk profile may have improved. While existing policies generally don't reduce premiums for improved health mid-term, you might get a better deal by applying for a new policy, particularly if your current one is several years old. Be cautious when cancelling old policies before a new one is firmly in place.
Leverage an Independent Broker
This cannot be stressed enough. An independent broker like WeCovr has access to the entire market and can pinpoint the insurers most likely to offer you the best terms based on your unique profile, including your postcode.
We understand the nuances of insurer underwriting and can guide you through the process, identifying providers who might be more favourable based on your specific circumstances, including your postcode's geodemographic profile. We can explain why certain insurers might be more competitive for you and help you navigate the application process to ensure accuracy and efficiency. Don't go it alone when expert guidance is available.
Dispelling Myths and Common Misconceptions
The discussion around postcode and insurance often generates myths. Let's clarify some common misunderstandings.
- Myth: "My postcode is in a 'bad' area, so I can't get cover."
- Reality: This is largely false. You almost certainly can get cover. The question is about the premium you'll pay. Insurers are in the business of selling policies, and they assess risk, not outright deny based on location alone. The UK has comprehensive protection insurance options for people across all postcodes.
- Myth: "Crime rate alone determines my premium."
- Reality: As detailed earlier, this is incorrect. Crime rates are part of a much broader, aggregated geodemographic dataset. They function as a proxy indicator for underlying socio-economic and health disparities. Your premium is influenced by thousands of data points, with your personal health and lifestyle being the most dominant factors.
- Myth: "Changing address will automatically lower my premium."
- Reality: Not guaranteed. If you move to an area with a statistically lower risk profile, a new policy might be cheaper. However, your existing policy's premium won't typically change simply because you move. Furthermore, moving to an area that statistically has a higher risk profile could see your premiums increase if you were to apply for a new policy. It's always best to re-evaluate your insurance needs when moving.
- Myth: "Insurers are discriminating against me because of my neighbourhood."
- Reality: Insurers operate on statistical probabilities, not personal prejudice. They assess aggregated risk based on large datasets. While the outcome might feel unfair if you're a perfectly healthy individual in a statistically higher-risk area, it's a data-driven process designed to ensure the financial viability of the insurance pool for all policyholders. Regulators like the Financial Conduct Authority (FCA) oversee these practices to ensure fairness and transparency where possible.
The Future of Underwriting: AI, Big Data, and Personalisation
The world of insurance underwriting is constantly evolving. Advances in artificial intelligence (AI), machine learning, and the availability of ever-more granular big data are set to refine risk assessment even further.
- More Granular Data: In the future, insurers might be able to incorporate even more precise data points, potentially moving beyond broad postcode segments to individual property or even hyper-local environmental factors.
- Behavioural Economics: There's growing interest in integrating behavioural data (e.g., from wearables, health apps – with explicit consent, of course) to offer more personalised premiums based on proven healthy behaviours.
- Ethical Considerations: As data becomes more granular, the industry and regulators face ethical questions around privacy, data security, and the potential for "digital redlining" – ensuring that increasingly precise risk assessment doesn't inadvertently exclude or unduly penalise certain groups. The balance between fair pricing and social inclusion will remain a critical debate.
For now, however, the principles outlined in this guide hold true: aggregated regional data, including factors indirectly correlated with crime rates, play a role, but your personal health and choices remain paramount.
Conclusion: Your Protection Journey – Informed Choices for Peace of Mind
The intricate relationship between your postcode's regional safety data and your LCIIP premiums is a testament to the sophisticated nature of insurance underwriting. While a higher crime rate in your area might not directly increase your personal risk of death or critical illness, it often serves as a proxy for a constellation of socio-economic and health factors that do influence life expectancy and morbidity.
Understanding that your postcode contributes to your overall risk profile, alongside your personal health, lifestyle, and occupation, empowers you to make more informed decisions. It highlights the critical importance of focusing on the factors you can control, such as improving your health and lifestyle, to positively influence your premiums.
Crucially, it also underscores the immense value of shopping around and leveraging the expertise of an independent broker. Because insurers have differing underwriting philosophies and risk models, the right broker can identify the provider most sympathetic to your unique circumstances, potentially securing you more favourable terms and better value for your essential protection.
Your LCIIP policies are not merely financial products; they are the bedrock of your family's financial security. Whether you're concerned about your postcode or simply want the best value, contacting an expert broker like us at WeCovr is a sensible first step. We can help you navigate the complexities, compare options from all major UK insurers, and ensure you have the peace of mind that comes with knowing you and your loved ones are adequately protected.
Sources
- Office for National Statistics (ONS): Mortality and population data.
- Association of British Insurers (ABI): Life and protection market publications.
- MoneyHelper (MaPS): Consumer guidance on life insurance.
- NHS: Health information and screening guidance.
Disclaimer: This is general guidance only and does not constitute formal tax or financial advice. Tax treatment depends on individual circumstances, policy terms, and HMRC interpretation, which cannot be guaranteed in advance. Whenever applicable, businesses and individuals should always consult a qualified accountant or tax adviser before arranging such policies.
Measure your family’s protection gap, then get the right life cover quote
Start with the score to see whether your family would face a real financial shortfall before moving on to life cover options.
Check what happens if someone dies too soon
See whether debt, dependants and mortgage risk are covered
Move into tailored life cover options after the score
Get your score
Your next best move
Get your score in minutes, then decide what kind of protection help would be most useful.
Score your household protection
See how well your current setup protects dependants, debt and major commitments.
Find the shortfall
Know whether life cover, critical illness or income protection is the actual missing piece.
Continue to tailored life cover
If life cover is the gap, continue to tailored life cover options.
What you get
A quick view of your current protection position
A clearer idea of where the biggest gaps may be
A direct route to tailored help if you want it